
The short answer
In our pilots, nanobubble generators were followed by measurable improvements in dissolved oxygen, ammonia, and organic-load measures. Every pilot also has a feature that stops us calling it proof. This article sets out the claim we make, what each pilot shows, and what would convince a sceptic.
The claim we are actually making
We do not claim that nanobubbles cure water bodies. The claim is narrower: a nanobubble generator that puts air, oxygen or ozone into water as bubbles under 200 nm can raise dissolved oxygen and speed up the biological and chemical processes that depend on it. That is a mechanism. Whether it pays off on a given site depends on the water, the load and what else is going on.
What each pilot shows
Our lake project at Rao Talao in Mira Bhayandar is ongoing, so no lake data appears here yet. The four pilots below are the ones we can report.
Sewage: Pirana STP, Ahmedabad
Raw sewage treated for 60 minutes with oxygen nanobubbles went from COD 145.88 to 20.84 mg/L and BOD 72 to 8 mg/L. With ozone nanobubbles, E. coli went from over 1,600 to under 2 MPN/100 mL. The confounder is scale: this was one bench sample, not a plant. Dissolved oxygen did not rise, and we do not yet know why. See the case study.
Turf: Wankhede Stadium, Mumbai
Over 30 days, irrigation water TDS fell from 750 to 550 mg/L and ammonia from 1.5 to under 0.5 mg/L. The confounder is that this is a single site with no control and tanker-supplied water, whose quality can vary between deliveries. See the case study.
Aquaculture: two pilots in Assam
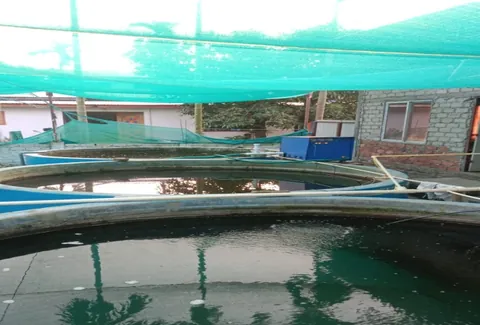
In the Tengra tank trial, nanobubble tanks had higher day-100 dissolved oxygen (8.2 and 7.8 mg/L against 6.0), lower ammonia and higher survival than the control. The confounder is that the control had half the aeration hours and twice the water exchange. In the Nadipar pond, dissolved oxygen rose from 3.5 to 7.6 mg/L and biomass grew about 3.5 times, but there was no control pond and temperature rose over the cycle. See the tank trial and the pond pilot.
What these pilots add up to
Sewage, irrigation water, fish tanks and a fish pond showed the same direction of travel on the measures you would expect oxygen to influence. That consistency is a reason to run more tests. It is not proof, because each result has an alternative explanation, and some of those explanations (aeration hours, temperature, the absence of a control) are specific to a single pilot.
Why the direction matters even when the size does not
If nanobubbles did nothing, we would expect pilots in different waters to scatter: some better, some worse, some flat. Instead, every pilot where oxygen was the plausible limiting factor moved in the direction oxygen would predict. Where the mechanism did not apply, it did not show: the Pirana oxygen batch left dissolved oxygen alone, and the ozone batch reduced COD far less than oxygen did. A treatment with a real mechanism should be helpful in some places and silent in others. That pattern is a modest point in its favour. It is still only a pattern across four reports, each with its own flaws.
What we do not know yet
- Bubble lifetime on our sites. Published studies report a wide range. We have not measured it ourselves, so we do not quote it.
- Energy use at plant scale. We have not run a metered comparison against fine-bubble diffusers.
- Dose-response. We do not yet have data showing how results change with the number of units on a given volume.
- Long-term effects. The longest pilot ran 100 days.
How to read our numbers
Three habits apply to every figure in our case studies. First, percentages are calculated from the table in the same report, never typed from memory, so you can check them. Second, we compare the first and last reading unless we say otherwise, which means a figure can hide a rise and a fall in between. Third, we write the co-treatments next to the result, not in a footnote.
You should apply the same habits to anyone else's numbers. If a supplier quotes a percentage improvement without saying what it was measured against, over what period, and with what else running, you cannot yet use it.
Why we publish the awkward results
A pilot report with only good news is a brochure. The missing control pond at Nadipar, the flat dissolved oxygen at Pirana and the uneven operating conditions in the Tengra tanks each reduce how strongly we can claim anything. They also tell an engineer where to look next. A municipal officer deciding whether to fund a pilot is better served by a supplier who has already found the weak points in their own data.
A note on what is missing
A reader will notice there is no lake in this list. Lake rejuvenation is the application we are best known for, and our lake project at Rao Talao is under way. We would rather publish its results when the project is complete than quote early numbers that may change.
What would convince a sceptic
- A matched control: two ponds or tanks run identically, with only the nanobubble generator different.
- Metered power and gas use, logged continuously, against an existing aeration system.
- Independent laboratory testing with replicates and stated sampling points.
- Pre-agreed targets, written down before the pilot starts.
- Reporting of every parameter, including the ones that do not move.
This is the pilot design we propose to new clients. It also guards against our own optimism: a design that can fail is the only kind whose success means anything. If you would like to run one, talk to an engineer.