
Stadium turf water treatment at Wankhede Stadium: a nanobubble pilot
A 33-day pilot treating turf irrigation water with a NanOxy, with before-and-after water tests and the limits of the data.
Summary
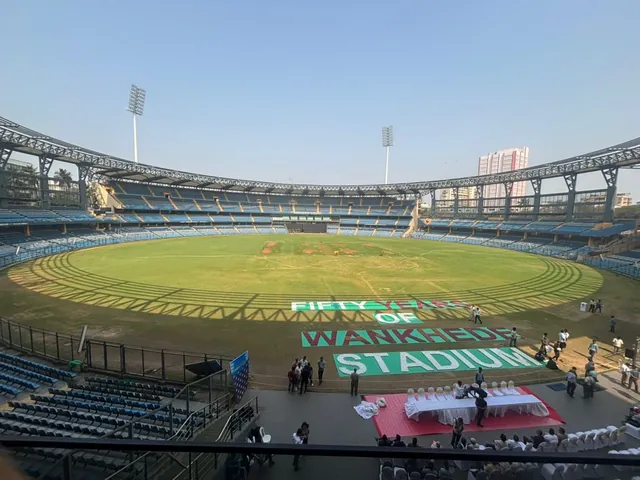
Wankhede Stadium needed better water for turf maintenance. From 8 May to 10 June 2025 a NanOxy treated the irrigation water supplied to the ground.
TDS fell from 750 to 550 mg/L, pH moved from 6.09 to 7.50, turbidity fell from 5 to 3 NTU, hardness from 150 to 130 mg/L and ammonia from 1.5 to below 0.5 mg/L.
The water was for turf irrigation, not drinking.
- Client
- Mumbai Cricket Association
- Location
- Churchgate, Mumbai
- Pilot
- 8 May to 10 June 2025 (33 days)
- Equipment
- NanOxy oxygen nanobubble generator
- Water
- Tanker-supplied water used to irrigate the turf
Method
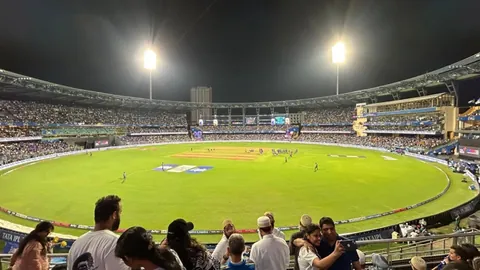
A NanOxy oxygen nanobubble generator treated the tanker-supplied water used to irrigate the turf. The pilot ran from 8 May to 10 June 2025, a period of 33 days.
The water was tested before treatment on 8 May 2025 and after on 10 June 2025. The parameters reported are TDS, pH, turbidity, hardness as CaCO₃, ammonia and reactive silica, which was below 5 mg/L in both samples. A separate sample taken on 5 May 2025 recorded conductivity.
Observations on the turf itself came from the ground team and were not measured.
Data
| Parameter | Before (8 May 2025) | After (10 Jun 2025) |
|---|---|---|
| TDS (mg/L) | 750 | 550 |
| pH | 6.09 | 7.5 |
| Turbidity (NTU) | 5 | 3 |
| Hardness as CaCO₃ (mg/L) | 150 | 130 |
| Ammonia (mg/L) | 1.5 | <0.5 |
| Reactive silica (mg/L) | <5 | <5 |
What the ground team reported
The grounds team reported greener turf in patchy zones, better moisture retention on the central pitch, less dew during evening matches and quicker patch recovery. These are their observations, not measurements. No turf, soil or irrigation-volume data was recorded.
Limitations
- One stadium, one 33-day window, no control plot.
- The data are a before sample and an after sample. Variation in the tanker supply between the two dates cannot be separated from the effect of treatment.
- Irrigation volume was not measured, so there is no water-saving figure.
- Turf observations are qualitative and come from the ground team.
Want similar data for your site?
We start with an assessment, agree what to measure, then run a pilot.