
Nanobubble technology pilot for sewage treatment at Pirana STP (180 MLD), Ahmedabad
A bench-scale trial on raw sewage from the 180 MLD plant, with oxygen and ozone nanobubbles. Not a plant installation.
Summary
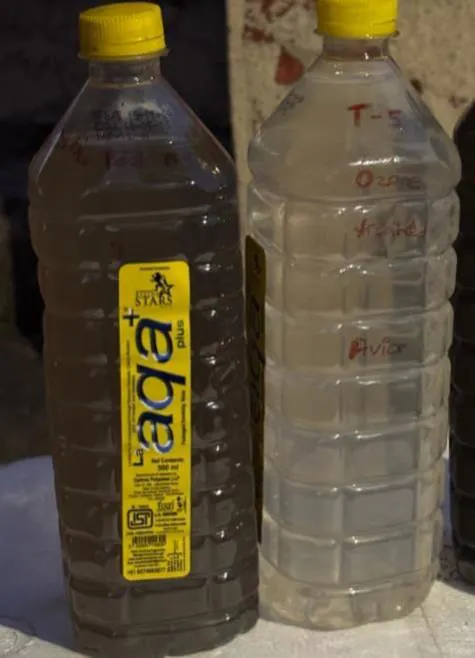
In December 2024 we ran a bench-scale trial on raw sewage from the 180 MLD Pirana sewage treatment plant in Ahmedabad. Raw sewage was treated for 60 minutes with oxygen nanobubbles in one batch and with ozone nanobubbles in another.
Oxygen nanobubbles cut COD by 86%, BOD by 89%, TSS by 81% and turbidity by 52%. Ozone nanobubbles brought E. coli below 2 MPN/100 mL and left total coliform absent.
This was a bench trial, not a plant installation. It is not a full-scale result.
- Client
- Ahmedabad Municipal Corporation
- Location
- Pirana, Ahmedabad, Gujarat
- Trial
- 3 to 5 December 2024 (bench-scale trial)
- Scale
- Bench scale: a raw-sewage sample of up to 100 litres (post screening and settlement), treated in 60-minute batches
- Unit used
- Avior Aqua bench unit: 6 m³/hr water flow, up to 5 LPM gas flow
Data
| Parameter | Raw sewage | Oxygen nanobubbles | Ozone nanobubbles |
|---|---|---|---|
| pH | 7.27 | 7.46 | 7.47 |
| TSS (mg/L) | 270 | 51 | 65 |
| COD (mg/L) | 145.88 | 20.84 | 112.54 |
| BOD, 3-day at 27 °C (mg/L) | 72 | 8 | 54.81 |
| TDS (mg/L) | 837 | 739 | 806 |
| Dissolved oxygen (mg/L) | 6.4 | 6.2 | 6.85 |
| Turbidity (NTU) | 61 | 29.1 | 32 |
| E. coli (MPN/100 mL) | >1600 | 1450 | <2 |
| Total coliform | Present | Present | Absent |
How to read it
- Oxygen nanobubbles did most of the organic-load work: COD, BOD and TSS all fell sharply. Dissolved oxygen did not rise (6.4 to 6.2 mg/L).
- Ozone nanobubbles did the disinfection work: E. coli fell from over 1,600 to under 2 MPN/100 mL. COD fell only 23% and BOD 24%.
- Together the two results explain why we pair oxygen and ozone units on some sites.
What this data does not show
- Bench scale: one sample of up to 100 litres, 60-minute batches, no replicates.
- Not a plant installation. Plant-scale performance, energy use and sludge effects were not measured.
- Dissolved oxygen did not increase with oxygen nanobubbles, so we make no dissolved-oxygen claim.
- Odour was observed but not recorded as a measured value, so we make no odour claim.
- Power draw of the unit was reported by the team, not measured, so we do not quote an energy figure.
Want similar data for your site?
We start with an assessment, agree what to measure, then run a pilot.