
Industrial ETP, Freudenberg NOK, Morinda: less sludge and fewer chemicals with nanobubbles
Two nanobubble generators went into the equalisation and MBBR tanks of an industrial effluent treatment plant in Punjab, with no civil changes. In the first full month, Freudenberg reports less sludge, lower chemical use and lower energy use.
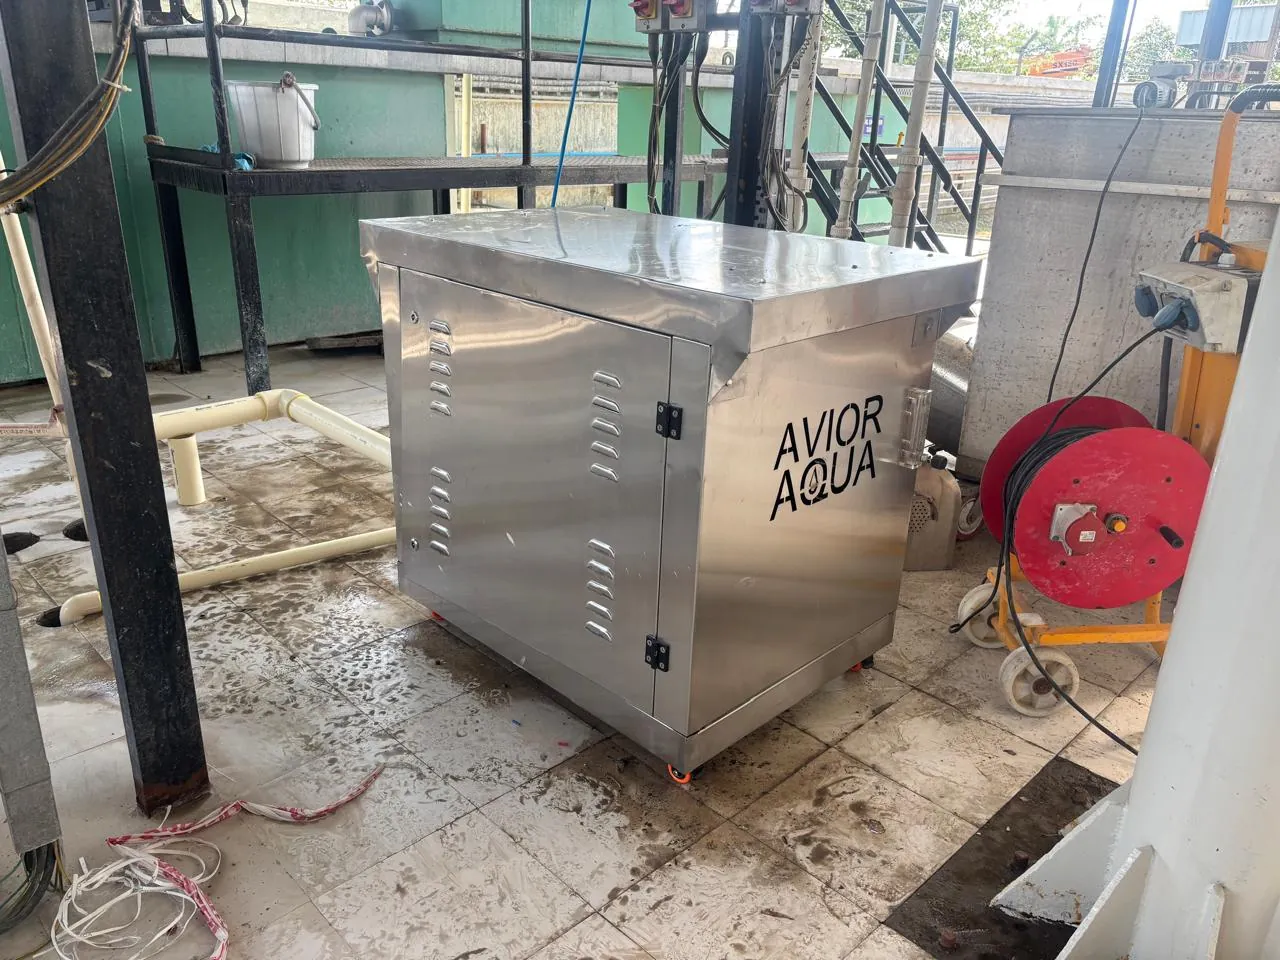
- Sludge
- −23.3%
- Coagulant
- −22.8%
- Caustic soda (NaOH)
- −87%
- Energy
- −26.9%
October 2026 against baseline, as reported by Freudenberg.
Summary
Sludge down 23.3% and energy use down 26.9%: those were the October 2026 results at Freudenberg NOK's effluent treatment plant in Morinda, Punjab, the first full month with two 5 HP nanobubble generators in its equalisation and MBBR tanks. Coagulant, caustic soda, polymer and hydrochloric acid use all fell.
- Client
- Freudenberg NOK, Morinda, Punjab
- Plant
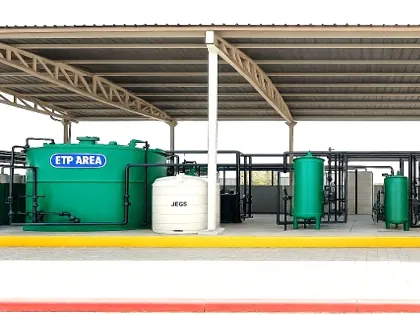
- Industrial effluent treatment plant: equalisation tank, MBBR, clarifier
- Equipment
- Two 5 HP nanobubble generators with a PSA oxygen concentrator
- Installed
- September 2026
- Results period
- October 2026 average against the plant's baseline
- Source of figures
- Freudenberg's project report, 4 November 2026
What was installed
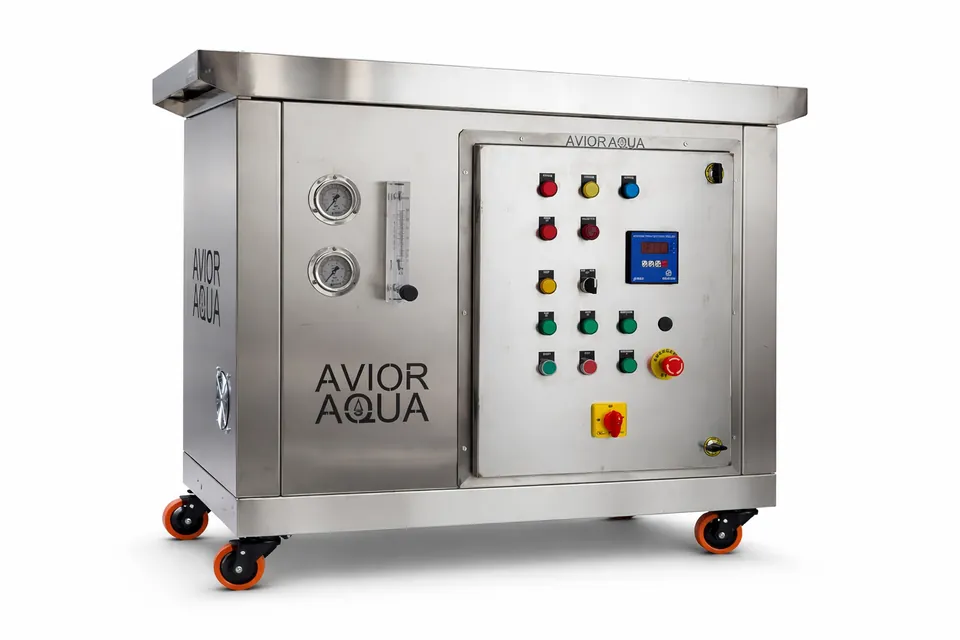
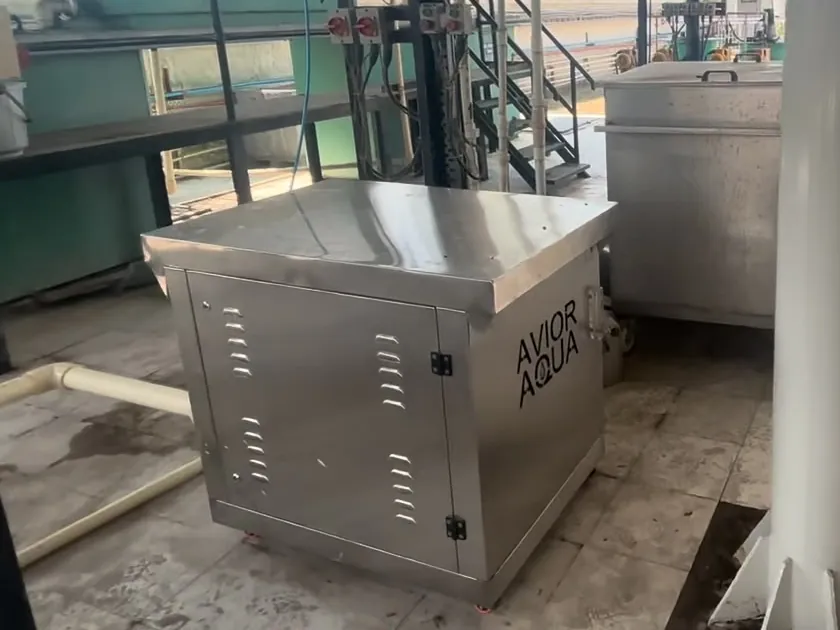
Two nanobubble generators, 5 HP each, were installed on 17 September 2026. A PSA oxygen concentrator, part of the nanobubble system, was added on 20 September 2026.
One unit in the equalisation tank keeps the effluent aerobic before biological treatment. One unit in the MBBR tank supplies dissolved oxygen through the media zone. No civil changes were made.
What changed, as reported by Freudenberg
Results reported by Freudenberg for October 2026, the first full month after installation, against the plant's baseline.
| Measure | Before (baseline) | After (October 2026 average) | Change |
|---|---|---|---|
| Sludge generation | 150 kg/day | 115 kg/day | −23.3% |
| Coagulant | 14 kg/day | 10.81 kg/day | −22.8% |
| Caustic soda (NaOH) | 2.6 kg/day | 0.32 kg/day | −87% |
| Polymer | 0.50 kg/day | 0.28 kg/day | −44% |
| Hydrochloric acid | 5 kg/day | 4.42 kg/day | −11.5% |
| Energy | 260 kWh/day | 190 kWh/day | −26.9% |
Caustic soda (NaOH) dosing stopped in October 2026 apart from a single dose on 7 October, which is why the monthly average is not zero.
On site
Process diagram
About these results
These are the first full month of results after installation. We will add later months as Freudenberg reports them.
A bioculture product listed in the project plan had not been dosed during this period.
Tell us about your site
We reply within one working day.
Tell us about your water body or plant
We agree targets after a water assessment, then run a pilot before any scale-up.